TravelingForMiles.com may receive commission from card issuers. Some or all of the card offers that appear on TravelingForMiles.com are from advertisers and may impact how and where card products appear on the site. TravelingForMiles.com does not include all card companies or all available card offers.
Some links to products and travel providers on this website will earn Traveling For Miles a commission which helps contribute to the running of the site – I’m very grateful to anyone who uses these links but their use is entirely optional. The compensation does not impact how and where products appear on this site and does not impact reviews that are published. For more details please see the advertising disclosure found at the bottom of every page
Although Marriott released details of its new award chart at the beginning of last week it was only partially useful to those of us who care about these things because it only gave us half the information we need.
The award charts told us what categories we can expect and how much properties in each category will cost but there was no information on which properties will appear in which categories.
Now we’ve been given some examples.
 Ritz-Carlton Abu Dhabi
Marriott has selected 91 hotels from 5 cities/regions and told us what categories they will be in come 1 August 2018. To help us out Marriott has reminded us of how many points an award night will cost in each of the new categories and shown us the difference between the current award price and the award price we can expect in August.
What Marriott decided not to illustrate is how the current award price compares to the off-peak and peak rates that we will be seeing in 2019….but I’ve taken care of that.
- All of the information provided by Marriott can be found in the first 5 columns of the charts you’ll find in this blog post.
- The last 4 columns show the off-peak and peak prices that will be introduced in 2019 together with how they differ from the current award price.
The charts are pretty big so they won’t be easy for you to read but you can expand them to a readable size just by clicking on whichever one you want to examine.
Here’s all the information we now have:
Bali
Caribbean & Mexico
Dubai
New York
Paris
Things To Note
- Not all properties in each city/region have been included in the information Marriott has provided (I don’t know why)
- We still don’t know what the split between off-peak, standard and peak season will be like. Will they be of similar length of will there be a bias towards one or two of these seasons?
- One all-suite property has now been included in the list (St. Regis Bali) and, contrary to what Marriott has told us, it fits into the award chart released last week (we were told that the all-suite properties were not accounted for by the new award chart).
The Headline Numbers
Properties increasing in cost:
- 10 of the 91 properties will cost more than they do now in off-peak season (~11%)
- 25 of the 91 properties will cost more than they do now in standard season (~27%)
- 70 of the 91 properties will cost more than they do now in peak season (~77%)
- Properties that will cost more during off-peak season will see the cost of an award night increase between 11% and 43% (most will increase by approximately 11 %)
- Properties that will cost more during standard season will see the cost of an award night increase between 11% and 67% (most will increase between 17 % and 25%)
- Properties that will cost more during peak season will see the cost of an award night increase between 11% and 95% (most will increase between 11 % and 67%)
Properties decreasing in cost:
- 74 of the 91 properties will cost less than they do now in off-peak season (~81%)
- 42 of the 91 properties will cost less than they do now in standard season (~46%)
- 2 of the 91 properties will cost less than they do now in peak season (~2%)
- Properties that will cost less during off-peak season will see the cost of an award night decrease between 5% and 33% (most will decrease between 11 % and 25%)
- Properties that will cost less during standard season will see the cost of an award night decrease between 3% and 33% (most will decrease between 3 % and 17%)
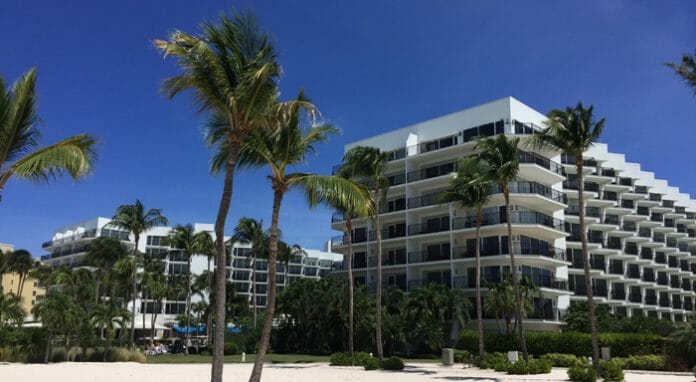
 Ritz-Carlton Aruba
Thoughts
It would be naïve to think that Marriott hasn’t indulged in a little cherry-picking here so that goes some way to explaining why, out of the sample provided, only 27% of properties are increasing in cost during standard season while 46% will cost less.
I will be dumbfounded if that ratio holds true when all properties have been allocated categories.
The numbers show just how key it will be for Marriott to be fair when it comes to splitting the year up between off-peak, standard and peak seasons – 81% of properties that Marriott has shown us will cost more during peak season than they do now and only 2% will cost less.
That’s a frightening ratio and may well be why Marriott decided not to show this comparison when it published the figures.
It’s interesting to note that most of the properties increasing in cost are increasing by between 11% and 67% (very approximately) while those that are decreasing in cost are decreasing by between 3% and 25% (very approximately) – that probably tells us quite a bit about what we can expect when the full category allocations are known.
This isn’t just about how many properties are costing more or less it’s also about how much those properties are increasing or decreasing in price.
I’m not sure what to make of the inclusion of the St Regis Bali in the examples provided by Marriott. We were expressly told that the all-suite properties were not accounted for in the new award charts and yet here we have one of those properties appearing in Category 8 and costing the same as any other Category 8 property.
 St Regis Bali – Image Starwood
If this were a sign of things to come it would be fantastic but I’m prepared to predict that this will be an outlier in the overall scheme of things – expect the St Regis Maldives to cost a lot more.
Lastly I should mention that there are a few strange decisions in this set of examples Marriott has chosen to provide:
The Westin Resort & Spa, Cancun will cost ~91% more in peak season than it does now and I can’t imagine (a) who thought that was a good idea and (b) who thinks that’s going to be a good value redemption – that’s crazy!
Then we come to the two Méridien properties in Dubai neither of which is particularly impressive but both will cost ~67% more in peak season then they do now. Who’s going to pay 60,000 points for either of these properties when you can book the Grosvenor House Dubai for 40,000 points during the same season?
The last strange choice that I’ll highlight (there are quite a few more) is the decision to increase the award cost of the Sheraton New York Times Square by 39% for standard season redemptions and by a staggering 67% for peak season redemptions.
 Sheraton New York Times Square – Image Starwood
This is a Sheraton we’re talking about and it’s going to cost just 10,000 points/night more than the New York EDITION during standard season – who would choose the Sheraton over the EDITION at those rates?
Bottom Line
It’s nice of Marriott to give us an insight into what properties are going to be in which categories but there’s still far too much missing information for us to reach solid conclusions.
What I can say is that I’m concerned about the number of properties that will cost more during peak season and I’m concerned that Marriott will be tempted to designate large parts of the year as “peak season” in regions heavy with aspirational properties.
This could be where the significant devaluation will lie and if we see many more properties following the example of the Ritz-Carlton Bali (50% more expensive in peak season) or the Sheraton New York Times Square Hotel (67% more expensive in peak season) there will be some very disenchanted Marriott/SPG loyalists out there.
Marriott may wish to point to a ~17% increase in earning rate an example of how things will be better for top-tier elites in the new combined loyalty program but that will be little consolation if we see large numbers of properties costing between 33% and 67% more for big portions of the year.


![The ideal 4 card American Express Membership Rewards team [Updated] a glass door with a picture of a man](https://travelingformiles.com/wp-content/uploads/2021/06/Amex-Centurion-Lounge-SFO-featured-741-356x220.jpg)


[…] Marriott’s Award Chart Examples (And What They Didn’t Show You) […]
what is defined as the “pea season”?
We don’t yet know.
It will almost certainly vary from region to region and probably even from country to country. In countries like Thailand where the rainy season happens at different times of year (depending on where you are) peak and off-peak seasons will probably vary from coast to coast too.
All should be revealed around 1 August 2018 (hopefully)